A Guide to Spirometry
The following article has been provided by Vitalograph and written by Bernard Garbe
The role of spirometry Office spirometry is a physiological test measuring exhaled volumes of air as a function of time. It is of irreplaceable value as a test of respiratory health in the same way that ECG and BP provide important information about general cardiovascular health. Spirometry gives an objective measurement of lung mechanics to help make or exclude a diagnosis, though a diagnosis cannot be made on the basis of spirometry alone.
Spirometry is recommended primarily for helping to diagnose and manage asthma and COPD, as well as a range of other diseases which may affect respiration. Spirometry is, however, only one way of objectively assessing COPD disease severity. Other measures, such as the BODE Index and quality of life assessment, help to build a more complete picture.
The standard spirometry test is a maximal forced exhalation (with greatest effort) after a maximal deep inspiration (completely full lungs). Several indices can be derived from this blow:
- FEV1 – Forced Expiratory Volume in One Second – the maximum volume of air that the subject is able to exhale in the first second. This is the single most important index.
- FVC – Forced Vital Capacity – the total volume of air that the subject can forcibly exhale. This can take as long as 20s in subjects with obstructive lung disease.
- FEV6 – Forced Expiratory Volume in Six Seconds – the maximum volume of air that the subject is able to exhale in 6s. FEV6 is a useful and validated surrogate for FVC.
- FEV1/VC – the ratio of FEV1 to VC, FVC or FEV6 (whichever larger) expressed as a unitless ratio - not a percentage to avoid confusion with percent of predicted.
Population predicted values are commonly used to compare to the current test results. This can have some value in a few specific applications, but mostly ‘predicted values’ create a smokescreen blinding the practitioner from the real valuable data within the spirometry report. Too often the opportunity for intervention or recognition of lung damage is lost because the spirometry test report appears to show that the data are in ‘normal range, above 80% of predicted’. The rate of decline of the FEV1 should be the focus of the practitioner. If a previous measure of FEV1 is available, ‘predicted values’ are relevant only to help determination of a normal rate of decline.
It is possible to find smokers with a rate of decline of FEV1 of >100ml per annum (normal is about 30ml) whilst they are still above ‘normal range’. If the rate of decline is not recognised, such individuals are simply classified as ‘normal’ (for a while – it could be years or even decades before they present with dyspnoea).
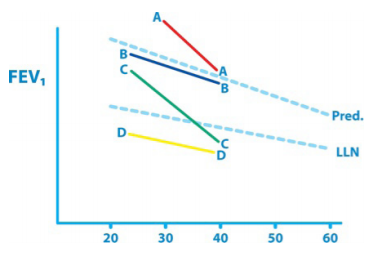 Pictured right is a representation of the well known ‘Fletcher-Peto diagram’ illustrating the natural history of COPD. FEV1 is shown against age in years. It illustrates that an abnormal decline in lung function may not be detected for decades if the subject starts off with normal lung function.
Subject B is normal and D could also be normal, falling into the 5% of ‘normals’ below LLN. Subject C is detected as abnormal after 2 decades. Subject A is abnormal (probably a smoker) but is not detected without serial measurement and plotting of FEV1.
Modern spirometers (not screeners or monitors) show the Z-score (or SDS) and the LLN (lower limit of normality) instead of ‘percent of predicted’. This is far better, but still assumes that the test subject is in the same population as the ‘predicted value’ population.